TryHackMe - Logstash - Data Processing Unit Walkthrough
Author: Mario Martinez Jr. (ku5e / Gary7) | TryHackMe USA Top 1%
Difficulty: Easy/Medium
Topics: Data Normalization, Pipeline Logic, Logstash Plugin Architecture
Answers are redacted within the narrative to allow you to complete the tasks on your own, but a full table of answers is available at the end of this walkthrough.
Logstash is the transformation engine of the Elastic Stack. Beats agents ship data efficiently but cannot normalize disparate logs at any meaningful depth. Logstash fills that gap: a server-side pipeline that ingests data from multiple sources and routes it to configured outputs after applying transformation logic.
Task 3: Elasticsearch Configuration
Elasticsearch provides the distributed search and analytics layer for the stack. We verify the service is listening on the correct interface and port to confirm it can receive data from Logstash. By default, Elasticsearch uses Port 9200 for its REST API.
We verify service status using standard Linux service management tools. The network.host setting in elasticsearch.yml determines the IP address the service binds to. In this lab, the host is bound to a private IP: 192.168.0.1.
Service Status:
systemctl status elasticsearch.service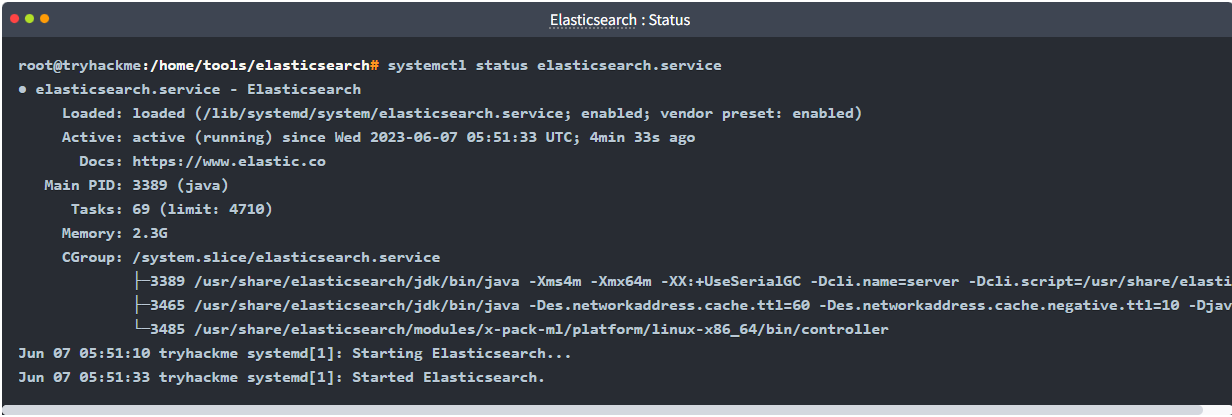
Version: 8.8.1
Task 4: Logstash Configuration
The Logstash global configuration file at /etc/logstash/logstash.yml controls the engine's behavior. The reload interval setting determines how frequently Logstash polls for changes in its pipeline configuration files. By default, this is set to 3s.

Task 5: Kibana Setup
Kibana operates on Port 5601 and provides the graphical interface for data analysis. Navigating the /etc/kibana/ directory reveals 3 primary configuration and security files required for the web service to function.
Task 6: Plugin Selection
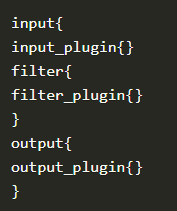
A Logstash pipeline consists of three distinct stages: Input, Filter, and Output. Logstash uses a modular plugin architecture for each stage. When dealing with unstructured text, the grok plugin maps strings into searchable fields. To clean up data—such as renaming a field or changing a data type—the mutate plugin is employed. If specific logs are identified as noise that should not be indexed, the drop plugin removes the event from the pipeline entirely.
Task 7: Pipeline Configuration
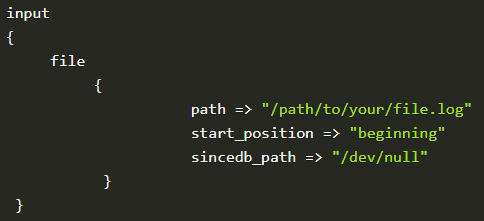
When defining a file input block, the path field is mandatory to tell Logstash which logs to tail. When sending data to the elasticsearch output, providing an index name is optional (nay), as Logstash can generate default daily index patterns automatically.
Task 8: Network Input and Codecs
To ingest a raw stream over the network, such as on Port 5678, the tcp input plugin is utilized. A csv codec can be applied within the input block to structure delimited data immediately upon arrival.
Task 9: Advanced Filter Syntax
To maintain lean indices, the prune plugin strips away empty or null fields. The critical element of this task is the complex mutate syntax. When renaming a field—such as converting a generic src_ip to a standardized source_ip—Logstash requires a specific hash-rocket representation inside nested braces:
rename => {"src_ip" => "source_ip"}
filter {
  mutate {
    rename => {"src_ip" => "source_ip"}
  }
}
Task 10: Output Configuration
Logstash supports multiple (yay) output plugins simultaneously. This allows an engineer to ship logs to a production Elasticsearch cluster while also printing them to a local file or the terminal for real-time debugging.
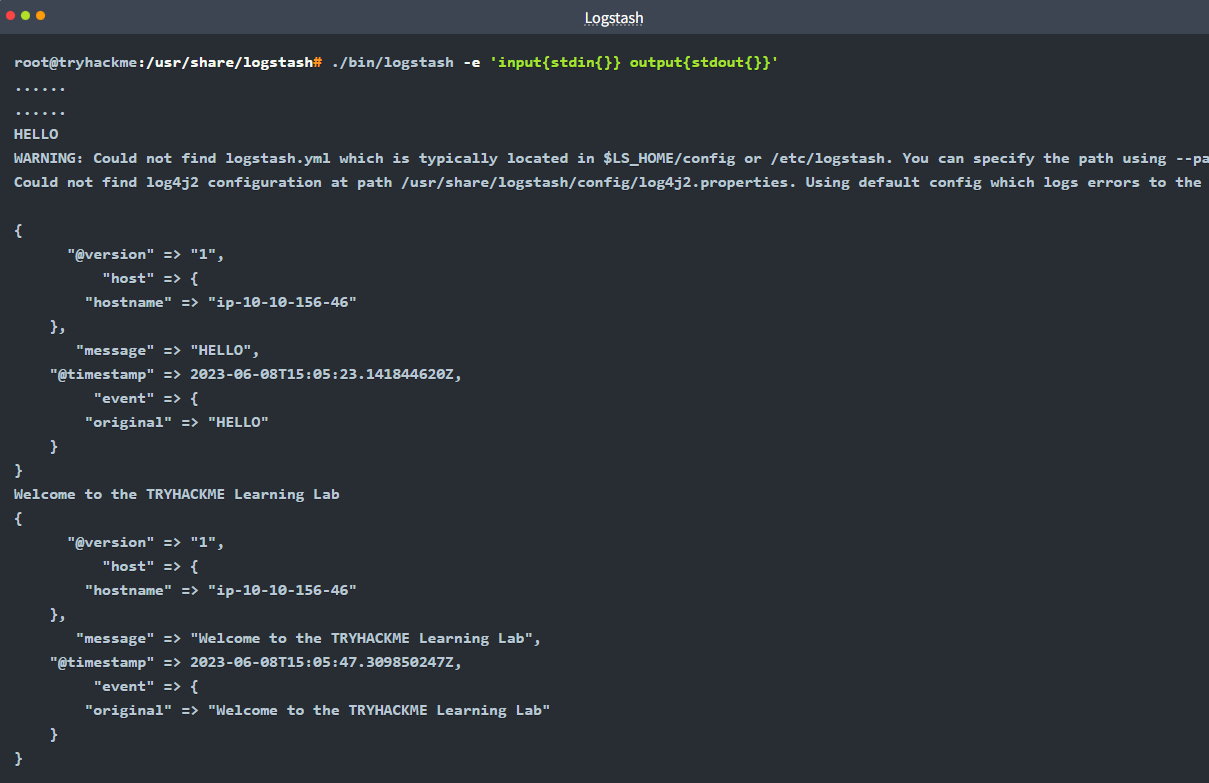
Task 11: CLI Testing
To verify logic without restarting the system service, the Logstash binary is used manually with the -f flag: logstash -f logstash.conf.
For a smoke test of a CSV filter, the logic flow is:
Input:
stdin(User input via terminal)Filter:
csv(Parsing the input)Output:
stdout(Printing the results to the terminal)
Final Flag Summary Table
| Task | Question | Answer |
|---|---|---|
| 3 | Elasticsearch Port | 9200 |
| 3 | Elasticsearch Version | 8.8.1 |
| 3 | Service Status Command | systemctl status elasticsearch.service |
| 3 | network.host default | 192.168.0.1 |
| 4 | Reload Interval | 3s |
| 4 | Logstash version | 8.8.1 |
| 5 | Kibana Port | 5601 |
| 5 | Files in /etc/kibana/ | 3 |
| 6 | Mutation Plugin | mutate |
| 6 | Drop Plugin | drop |
| 6 | Unstructured Parser | grok |
| 7 | Index Mandatory? | nay |
| 7 | Required field in file input | path |
| 7 | 3rd CSV Field Option | columns |
| 7 | Output plugin used | elasticsearch |
| 8 | TCP Input Plugin | tcp |
| 8 | CSV Codec Plugin | csv |
| 9 | Remove Empty Fields | prune |
| 9 | Rename/Modify Plugin | mutate |
| 9 | Complex Mutate Syntax | rename => {"src_ip" => "source_ip"} |
| 10 | Multiple Outputs? | yay |
| 10 | Console Output Plugin | stdout |
| 10 | Syslog Configuration | syslog,host,port |
| 11 | Run Config Command | logstash -f logstash.conf |
| 11 | CSV Test Flow | stdin,csv,stdout |
Walkthrough by Mario Martinez Jr. (ku5e / Gary7) | TryHackMe Profile | blog.ku5e.com